The pipeline maths I run before every quarter
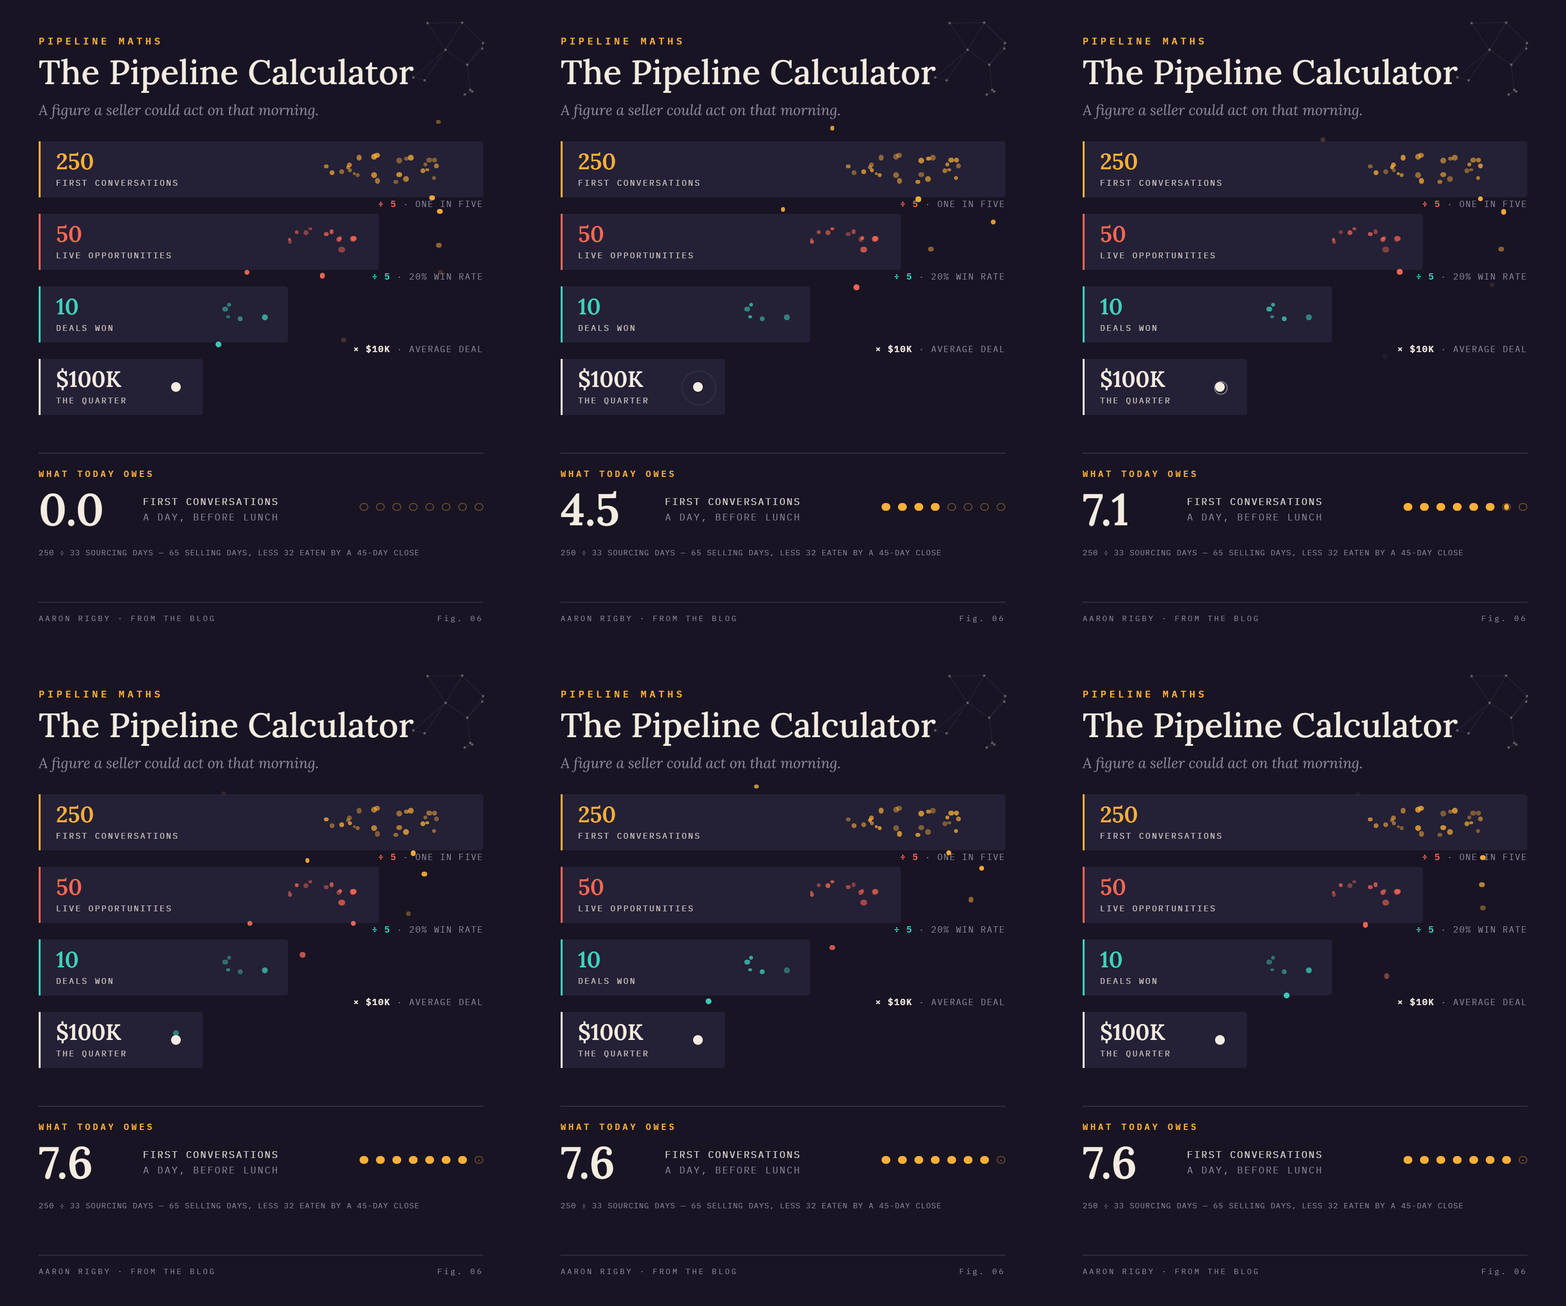
You know the call. Last Friday of the month, forecast due, and the CRM gets updated in the hour before it. Dates slide to the right. Probabilities get rounded up. One deal has been sitting at 70 percent since March and nobody has asked it a hard question in weeks. Whatever comes out of that hour gets read to a board.
I've been asking sales leaders around the region the same question for a few months now. How many first conversations does one of your sellers need to hold today, before lunch, to land the number they signed up for? I get an estimate every time. Sometimes a good one. I have not yet been handed a figure a seller could act on that morning.
That gap is fixable this week, and it does not need a new platform. It needs an afternoon.
Data structure
Say you carry a 100,000 dollar quarter and your average deal is 10,000. Ten deals.
100,000 quarter ÷ 10,000 a deal = 10 deals
10 deals at a 20 percent win rate = 50 live opportunities
50 opportunities at one in five = 250 first conversations
65 selling days, less 32 eaten by a 45 day close = 33 days you can source in
250 conversations ÷ 33 days = 7.6 a day
The close time is the part everyone misses. A 45 day close means anything started after day 33 signs next quarter, so the sourcing window is half the quarter. And 7.6 a day assumes your seller walks in with an empty CRM, and none of them do. Take off what is already signed, count the live opportunities at the same win rate, and the daily number only ever applies to the gap that is left.
From there it is levers. More activity only touches the deals that have not happened yet. A better win rate lifts every opportunity already in the CRM as well as everything still to come, so it always pays off bigger. It is also slower: past a few quick fixes, lifting a win rate is a year of serious coaching, not something anyone pulls in a week. In every team I've run, the activity lever is the one that gets pulled first anyway.
Neither lever reaches 100,000. Nothing your seller controls reaches 100,000.
That is worth knowing in the first week, while you can still argue about the target, the deal size, the headcount, or how much pipeline gets built before a quarter opens. In week eleven the same arithmetic is only an explanation for missing.
None of this is new. I've been running it for twenty years and it is a spreadsheet. AI does it faster and gives you a better looking dashboard, which is roughly where AI stops on this part of the job.
Calculator below if you want to run your own numbers.
This is a day one number. Run it again on day two and it has already moved, and it keeps moving every day to the end of the quarter. As an IC I ran it weekly at a book level and every two weeks at a deal level, which was a good enough read on what my output needed to be to land the juicy bonus at the end of the quarter. Now, with dozens of sellers under me, it is what I expect of my teams: every seller on top of their own number, every manager on top of whose number has moved.
Data hygiene
Structure only works if what goes into it is true, and this is where the teams I've run have broken first.
A team win rate of 30 percent tells you almost nothing on its own. Behind it sits one seller having more conversations than anyone and logging a third of them, so on paper her activity looks thin, her conversion looks unbeatable, and neither number is real. Another logs every call and holds one conversation a day, so her numbers are honest and the problem they show is activity. A third closes seven of every ten opportunities he opens, and nobody has sat down with him to work out what he does differently. Three different sellers requiring three different conversations and coaching. All of which need different data and different perspective, which is impossible if the data can't be trusted.
Every seller has their own number at every stage of the funnel. Until you hold those numbers per person rather than per team, you cannot project the quarter and you cannot help anyone improve, because you do not know which part of their funnel is actually broken.
Data culture
I like the data, which has made me the odd one out on most sales floors I've worked on. The friction has been the same on every team I've run. Sellers treat the CRM as the thing their manager checks, so it gets filled in on that last Friday with dates that are half guesswork, and the number that reaches the board inherits all of it.
That behaviour changes when the CRM starts telling the seller where their own commission is leaking rather than where their manager's forecast is. Show a seller that ten points of win rate is worth more to her than fifty percent more meetings, and Tuesday's call gets logged on Tuesday. You cannot mandate your way there. You can only make the data useful enough to the person entering it that they want it to be right.
Where AI earns its place
Pipeline maths gives you the what. Your team stalls at 25 percent between opportunity and close, and now you know it in numbers rather than in feel. It still does not tell you why.
The why has always been intuition. The best sellers I've worked with are excellent in a room and they know it, so the explanation stops at "I know my stuff and I was on that day". For twenty years that was as far as anyone could take it.
It is not the limit anymore. Put the call transcripts, the emails, the product tickets, the client interviews, the exit interviews, the roadmap and what people write about your product online into one graph. Link it, then run an inference layer over the top. Now ask why the team stalls at 25 percent and look at what the lost deals have in common. The answer comes back as evidence rather than a hunch, and it comes back per seller, which is the version you can coach against.
One pattern from my own years running India and Southeast Asia: sellers asking a client for five thousand when the budget in the room was fifty or a hundred. Culturally, the money conversation is an awkward one, and the transcripts showed exactly who was shrinking from it. That turned into coaching on confidence rather than another lecture about activity. It moved the numbers. We used to say that if you are not gripping the table when you tell a client the price, you are not asking for enough.
That is the system I wrote up in Unfinished Business, and it is the part that takes real work. The arithmetic at the top of this piece takes an afternoon.
Take the afternoon before the next quarter opens. If the maths says the target is not possible, you want that on the first Monday, while there is still time to change the target. (like that has ever happened...)

The knowledge graph and inference layer described at the end of this piece are the subject of Unfinished Business.
Read more about the book →One email, every second Friday.
What I'm learning about running commercial teams in the AI era.